This is the multi-page printable view of this section. Click here to print.
Blog
- 454 Bio Unveils Revolutionary Open Source DNA Sequencing Platform
- Polymerase competition
- January 8 update
- S0592 Sequencing Results
- Sequencing run S0592 complete! Final step: Analysis
- Setting up Sequencing Run S0592
454 Bio Unveils Revolutionary Open Source DNA Sequencing Platform
454 Bio Unveils Revolutionary Open Source DNA Sequencing Platform
454 Bio, a leader in biotechnological innovation, is excited to announce the launch of a groundbreaking open source DNA sequencing platform. This pioneering initiative is set to democratize the field of genetic analysis by providing open access to DNA sequencing technology.
For the first time ever, individuals around the world can download instructions to build their own DNA sequencing devices. This platform is designed to be user-friendly, making complex molecular biology accessible to everyone. It is a significant stride in our commitment to making advanced scientific tools more inclusive and affordable.
Key features of the platform include:
- DIY DNA Sequencing Device Instructions: Detailed, easy-to-follow guides for constructing DNA sequencing devices at home.
- Customizable Sequencing Kits: Users can create application-specific sequencing consumables, tailored to their individual research needs.
- Simplified Molecular Biology Protocols: The platform simplifies complex procedures, making them manageable for non-experts.
- Community-Driven Innovation: Users are encouraged to share their modifications and improvements, fostering a collaborative environment for continued development.
Our open source platform is not just a tool for scientific exploration; it represents a fundamental shift in how we approach genetic research. By empowering individuals to conduct their own experiments, we are paving the way for a new era of personalized medicine, agricultural development, and biodiversity conservation.
We believe that by providing open access to DNA sequencing technology, we can spark a global movement of citizen scientists. This platform is more than just a technological advancement; it’s an invitation to be part of a community that is reshaping the future of genetics.
Join us in this exciting journey to unlock the mysteries of DNA. Visit https://454.bio for more information and to download the platform today.
About 454 Bio
454 Bio is at the forefront of biotechnological innovation, committed to making advanced scientific tools accessible to everyone. Our mission is to foster a community of discovery and inspire the next generation of scientists.
For more information: info@454.bio
For more information on the Open Source DNA Sequencing Platform: https://454.bio
Polymerase competition
454 Bio have opened a competition with a prize of $200,000.00 to evolve a DNA polymerase optimized to use Lightning Terminators™️ while not incorporating their hydroxymethyl cleavage products with a minimum 1000:1 ratio.
See below for the full details.
January 8 update
Proposed January 8 goal
1000 20 Q17, with reads filtered only using the first four bases.
How we will get there
- Quantify incorporation, cleavage, lead, lag, and decay based on fitted experimental results
- Add images to monitor incorporation and cleavage completion
- Run Mel’s code for lead, lag, and droop values
- UV light coupling improvement
- Increase cleave efficiency
- Reduce dark base generation
- Jon Schultz’s dark microbeads
- Reduce stray light into bulk solution of sequencing reservoir impacting photobleaching, cat’s eye, and dark base generation
- DISCS
- Evaluate point of minimal DISCS + Pol complex interference with sequencing reaction
- Lightning Terminators™
- Test LTs with different dyes or non-dye LTs; Concentration
- One pot buffers
- Many sequencing runs across 2 instruments, automated data mining to aid in selecting quality predictors for non-cherry * picked clusters using 4 base key
- Photoacid
- Automated fast analysis for image pre-processing through signal processing
Current sequencing performance

Best run
| Run ID | Library | Cycles | Mapped reads | Longest read length (bp) | >= 10 bp perfect reads | All reads Q score | Real filter Q score |
|---|---|---|---|---|---|---|---|
| S0592 | cir16m | 16 | 4927 (54% of all ROIs) | 16 | 958 (19.4% mapped reads) | 4903 10Q10.6 | 1859 10Q13.4 |

Analysis: lead and lag
Incomplete extension (ie) and carry forward (cf): for first 2, 3, 5 cycles fitting
S0592 (AG DISCS)
| S0592 | Q_score | ie_exp | cf_exp | dc_exp | |
|---|---|---|---|---|---|
| Cluster_1268 | CGTATCGACGATGCAG | 30 | 0.21 | 0.05 | 0.13 |
| Cluster_1268 | CGTATCGACGATGCAG | 30 | 0.16 | 0.13 | 0.01 |
| Cluster_1268 | CGTATCGACGATGCAG | 30 | 0.2 | 0.13 | 0.01 |
| Cluster_3718 | ATGCAGTCGACGTACT | 30 | 0.31 | 0.05 | 0.01 |
| Cluster_3718 | ATGCAGTCGACGTACT | 30 | 0.36 | 0.05 | 0.105 |
| Cluster_3718 | ATGCAGTCGACGTACT | 30 | 0.32 | 0.12 | 0.125 |
| Cluster_5806 | TCAGGACGATGACTGC | 7.27 | 0.15 | 0.16 | 0.52 |
| Cluster_5806 | TCAGGACGATGACTGC | 7.27 | 0.11 | 0.12 | 0.36 |
| Cluster_5806 | TCAGGACGATGACTGC | 7.27 | 0.17 | 0.14 | 0.295 |
| Cluster_65 | GACTCTATTCTCAGTA | 6.02 | 0.22 | 0.09 | 0.55 |
| Cluster_65 | GACTCTATTCTCAGTA | 6.02 | 0.23 | 0.09 | 0.31 |
| Cluster_65 | GACTCTATTCTCAGTA | 6.02 | 0.2 | 0.16 | 0.135 |
S0577 (No DISCS)
| S0577 | Q_score | ie_exp | cf_exp | dc_exp | |
|---|---|---|---|---|---|
| Cluster_2532 | CGTATCGACGATGCAG | 12.04 | 0.06 | 0.05 | 0.01 |
| Cluster_2532 | CGTATCGACGATGCAG | 12.04 | 0.18 | 0.06 | 0.025 |
| Cluster_2532 | CGTATCGACGATGCAG | 12.04 | 0.18 | 0.05 | 0.13 |
| Cluster_6083 | ATGCAGTCGACGTACT | 30 | 0.24 | 0.05 | 0.01 |
| Cluster_6083 | ATGCAGTCGACGTACT | 30 | 0.32 | 0.05 | 0.01 |
| Cluster_6083 | ATGCAGTCGACGTACT | 30 | 0.26 | 0.07 | 0.01 |
| Cluster_10085 | TCAGGACGATGACTGC | 12.04 | 0.15 | 0.18 | 0.025 |
| Cluster_10085 | TCAGGACGATGACTGC | 12.04 | 0.12 | 0.1 | 0.06 |
| Cluster_10085 | TCAGGACGATGACTGC | 12.04 | 0.14 | 0.11 | 0.075 |
| Cluster_19 | GACTCTATTCTCAGTA | 11.14 | 0.49 | 0.16 | 0.5 |
| Cluster_19 | GACTCTATTCTCAGTA | 11.14 | 0.45 | 0.24 | 0.37 |
| Cluster_19 | GACTCTATTCTCAGTA | 11.14 | 0.43 | 0.3 | 0.25 |
- High decay in cycle 1 due to large signal loss in the 2nd cycle
- High lag observed for “G” attributed to UV cleavage, with different bases displaying distinct features
- The addition of DISCS results in a decrease in “cf” for G but an overall increase in “dc”
- Generally, “ie” and “dc” perform worse than “cf,” with UV cleavage identified as the primary issue, followed by decay caused by DISCS, and darkbase generation ranking third
Characterization of imaging systems

Mk 3.02

Mk 3.03
| Specs | MK3.02 | MK3.03 |
|---|---|---|
| Magnification | 5.71x | 4.04x |
| CMOS Type | SONY IMX477, 1.55um/pixel (*mono$700) | SONY IMX183 2.4um/pixel ($550) |
| CMOS to Chip Distance | 210.1mm | 166.9mm |
| CMOS size | 6.28x4.71mm (4056x3040 pixel) | 13x8.76mm (5440x3648 pixel) |
| FOV (in mm2) | 1.1x0.83mm | 3.23x2.17mm (7.7x larger Img area) |
| Imaging Lens | 5x Olympus NA=0.15 ($500) | 5x Bolioptics NA=0.13 ($50) |
S0592 Sequencing Results
Data analysis is finished, and the results are in! Here’s a quick first look at the data from the .html summary output with some key metrics highlighted:
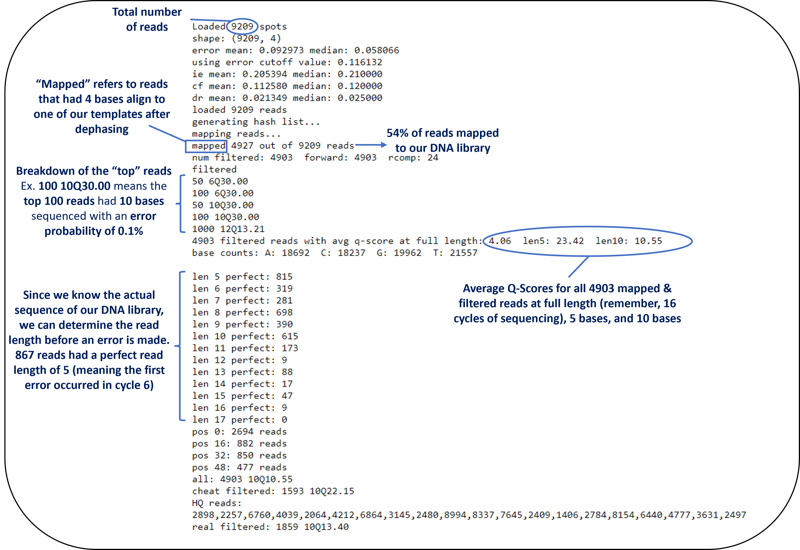
Getting an idea of how many reads were loaded compared to how many mapped is important; low mapping rate can indicate issues with the sequencing substrate or with imaging. This run looks good- we had a mapping rate of 54%, with 4927 mapped reads out of 9209.
Another important metric is the average Q-score for all of the mapped and filtered reads. This output breaks down average Q-score for all reads in three ways:
- Full read length: this will vary depending on how many cycles of sequencing your experiment has. This run had 16 cycles.
- Read length of 5 bases: this will consider the first 5 bases of each read. Typically we see Q-scores around 20-25 for the 1st 5 bases. This is an important metric to track when changing experimental conditions that may impact sequencing quality.
- Read length of 10 bases: this considers the first 10 bases of each read. We typically see a large drop in Q-score between 5 and 10 bases, so it’s good to track this metric to gauge improvements with experimental conditions.
Since our sequencing library is a pool of four known synthetic templates, we can look at Q-scores as a “probability of error” and we can look at the actual error rate. The plot below shows % error rate for the mapped filtered reads at each position in the read for all 16 cycles.
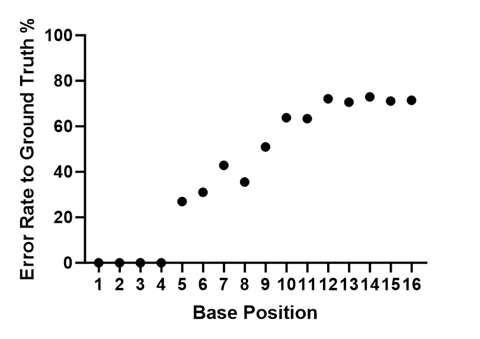
Average Error Rate (%) at each position in the filtered and mapped reads for S0592.
While the Q-Score provides information to help understand the probability of error in the whole read at different lengths, the bottom section highlighted in the .html summary report above shows exactly how many correct bases were sequenced for all of the filtered reads before an error was made. You can quickly see that many reads had 8 bases that matched our known library perfectly before an error was made.
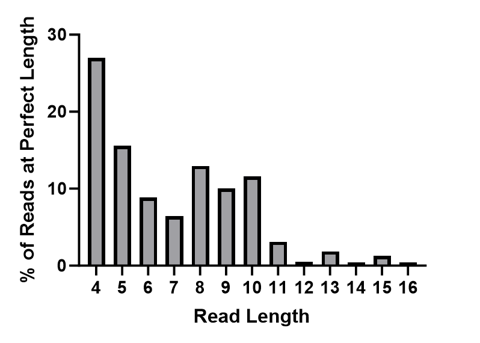
Graphical representation of “Perfect” Read Length for all of the filtered and mapped reads from S0592.
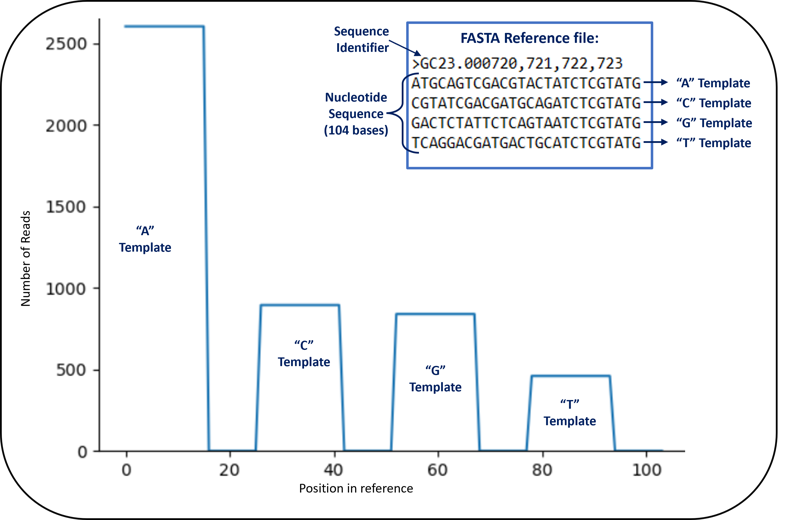
Another helpful bit of information from the .html summary is the alignment graph below. In a typical NGS analysis, you would take your sequencing data and run it through an alignment tool that compares basecalls to an organism-specific reference sequence. Since we are sequencing short synthetic templates we designed ourselves, we can create our own reference and align our sequencing data to that reference. The figure below shows a snippet of our 104 nucleotide reference sequence. There were 4 templates included in the reference sequence, each 26 nucleotides long. Since we only sequenced 16 bases, we expected all of our reads to align to positions 1-16, 27-42, 53-68, and 79-94 in the reference sequence. Those positions correspond to the first 16 bases in the A, C, G, and T templates.
There are numerous other outputs, including the sequencing output in FASTQ format. You can use the existing 454 Bio toolset to look deeply at your data, utilize your favorite existing tools, or create you own and share your tools and results with the 454 Bio Community!
Sequencing run S0592 complete! Final step: Analysis
After 16 cycles of incorporation, imaging, and cleaving, sequencing run S0592 is complete! All that’s left to be done is to run through the analysis pipeline.
The first step is the Image Pre-Processing Module. The raw sequencing images are fed through this module, and the output is a folder containing all of the pre-processed and registered images. Pre-processing cleans up the raw images up to ensure sequencing clusters can be identified at each cycle and any interfering surface imperfections or debris are excluded from analysis.
S0592 Image Pre-Processing Input:
S0592 Image Pre-Processing Output:

The Pre-Processed Images are used as input for step two of the analysis pipeline: ROI Detection, Intensity Extraction, and Auto-Dictionary. This step of the pipeline includes defining all of the sequencing clusters in the images (referred to as “ROIs”- Regions of Interest); extracting the intensity values from each sequencing cluster (ROI) across all 4 channels in all 16 cycles of sequencing; and defining the color composition for A, C, G, and T (referred to as the dictionary) using signal across all 4 channels for a representative A, C, G, and T cluster.

The output of interest from the ROI Detection, Intensity Extraction, and Auto-Dictionary step in the pipeline is a .csv file. This file will contain coordinates and signal data from all 4 channels for each ROI and the 4 base dictionary across all 16 cycles. We expect our dictionary to reflect the dominating signal for each of the four Lightning Terminators™:
| Lightning Terminator™ (base) | Dominating Signal |
|---|---|
| LTdA | 590, “orange” |
| LTdC | 525, “green” |
| LTdG | 445, “blue” |
| LTdT | 645, “red” |
ROI Detection, Intensity Extraction, and Auto-Dictionary Input:
ROI Detection, Intensity Extraction, and Auto-Dictionary Output:
The third module data is fed through is the Color Transformation. This algorithm does a few important things to the Cluster_intensities.csv data:
- Compares the unique color compositions for each sequencing cluster to the dictionary for A, C, G, T. We expect high signal in one channel for each of the 4 bases
- Calculates the relative amount of each base in each cluster using the measured color composition at cycle 1 compared to the dictionary
- Repeats this process for each cycle of sequencing for all identified clusters
Color Transformation Input:
Color Transformation Output:
At cycle one of sequencing, we expect clusters to have high amounts of one Lightning Terminator. At cycles greater than one, however, clusters will have lower purity as dephasing accumulates. Here’s an example of Color Transformation results for one cluster across 5 cycles:

At cycle 1, this cluster has LTdT (red) incorporation- when we get to basecalling, this cluster will definitely be a “T”. At cycle 2, things are a little less obvious. It looks like some “T” is remaining from cycle 1. In addition, there is blue in our color transformed results indicating a G was incorporated. There’s also a very small amount of green C present. To make a basecall at cycle 2 and greater, it will be helpful to put this data through the Dephasing algorithm.
Looking at the color transformed data above, it is clear our data has been impacted by dephasing. Our sequencing clusters each have thousands of copies of the same DNA molecule being sequenced. At cycle 1, when we should not see any dephasing, all of the sequencing primers will be extended to the first base in the template DNA. Dephasing can manifest in many ways using our LED-TIRF Transformer along with Lightning Terminators™, but dephasing will always fall into one of two categories (although we will see both in the same clusters!):
-
Lead: when some extended sequencing primers are at a position in the template greater than the number of cycles.
ex.: At cycle 7 of sequencing, every sequencing primer in the cluster should be extended to the 7th base in the sequencing template. If we see evidence that some primers have extended to the 8th, or even 9th base in the template, there is lead.
-
Lag: when some extended sequencing primers are at a position in the template less than the number of cycles.
ex.: At cycle 7 of sequencing, every sequencing primer in the cluster should be extended to the 7th base in the sequencing template. If we see evidence that some primers have only extended to the 5th or 6th base, there is lag
Luckily, the final step in our analysis pipeline will attempt to account for lead and lag to generate base calls, quality scores, and align the data to a reference. The Dephasing and Basecaller module attempts to find the best-fit model of lead and lag parameters for the color transformed data. The dephasing parameters are used to generate basecalls which are all given a quality score. The basecalls are finally aligned to a reference, and since we’re working with known sequencing templates, we can also determine the error rate. This module has numerous outputs, one of which is sequencing data in FASTQ format. The FASTQ can be fed into some of 454 Bio’s Open Source analysis modules, existing bioinformatics tools, or you can develop your own workflows to share with the 454 Bio Open Source Community!
Mel’s Code Input:
Mel’s Code Output:
Setting up Sequencing Run S0592
Today at 454 Bio Jinchun set up our 592nd sequencing run: S0592.
This was a standard sequencing run- Jinchun used all of the protocols laid out in Docs to prepare the sequencing reservoir for sequencing on the Mk3 Transformer. To record experimental details about this run, Jinchun filled in the helpful Seq-Setup-Worksheet:

All of the materials and reagents were prepared ahead of time. Solutions were made for hybridizing the sequencing primer, loading Therminator polymerase, and sequencing. Jinchun pre-heated the Transformer to 65 C.
Once the transformer reached 65 C, Jinchun hybridized the sequencing primer. This process takes about 20 minutes: 10 minutes on the pre-heated Transformer, then 10 minutes on the benchtop. Once the sequencing reservoir goes from Transformer to benchtop, Jinchun adjusted the temperature on the Transformer to 58 C for the sequencing run.
After hybridizing the sequencing primer, Therminator was pre-loaded onto sequencing clusters. This quick incubation step was followed by a rinse with OPB (One Pot Buffer). This rinse is especially critical if DISCS system is being used. Any unbound Therminator remaining in solution has the potential to extend DISCS templates with Lightning Terminators™; rinsing minimizes the chances of this happening.
Once Therminator was loaded and rinsed, Jinchun carefully added 400 µL of Sequencing solution to the reservoir to ensure no bubbles formed. The reservoir was quickly inserted into the Transformer and locked into place. Lightning Terminators™ immediately begin incorporating, so Jinchun was able to set the focus positions for each LED during the 10 minute cycle 1 incorporation incubation.
When the 10 minute incubation was just about finished, Jinchun double checked all of the focus positions still showed fluorescent sequencing clusters sharply in focus. As soon as his timer went off he hit “Start Protocol” and the Transformer took over the sequencing run. Jinchun went and got some lunch at Pa’s Place.