S0592 Sequencing Results
Data analysis is finished, and the results are in! Here’s a quick first look at the data from the .html summary output with some key metrics highlighted:
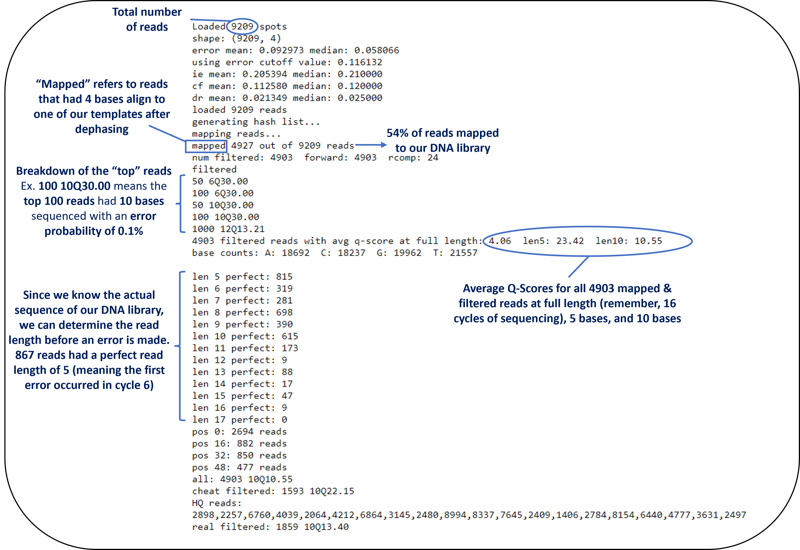
Getting an idea of how many reads were loaded compared to how many mapped is important; low mapping rate can indicate issues with the sequencing substrate or with imaging. This run looks good- we had a mapping rate of 54%, with 4927 mapped reads out of 9209.
Another important metric is the average Q-score for all of the mapped and filtered reads. This output breaks down average Q-score for all reads in three ways:
- Full read length: this will vary depending on how many cycles of sequencing your experiment has. This run had 16 cycles.
- Read length of 5 bases: this will consider the first 5 bases of each read. Typically we see Q-scores around 20-25 for the 1st 5 bases. This is an important metric to track when changing experimental conditions that may impact sequencing quality.
- Read length of 10 bases: this considers the first 10 bases of each read. We typically see a large drop in Q-score between 5 and 10 bases, so it’s good to track this metric to gauge improvements with experimental conditions.
Since our sequencing library is a pool of four known synthetic templates, we can look at Q-scores as a “probability of error” and we can look at the actual error rate. The plot below shows % error rate for the mapped filtered reads at each position in the read for all 16 cycles.
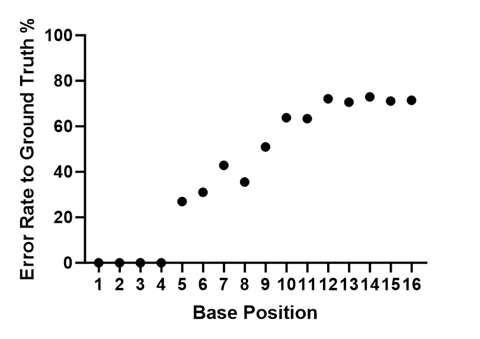
Average Error Rate (%) at each position in the filtered and mapped reads for S0592.
While the Q-Score provides information to help understand the probability of error in the whole read at different lengths, the bottom section highlighted in the .html summary report above shows exactly how many correct bases were sequenced for all of the filtered reads before an error was made. You can quickly see that many reads had 8 bases that matched our known library perfectly before an error was made.
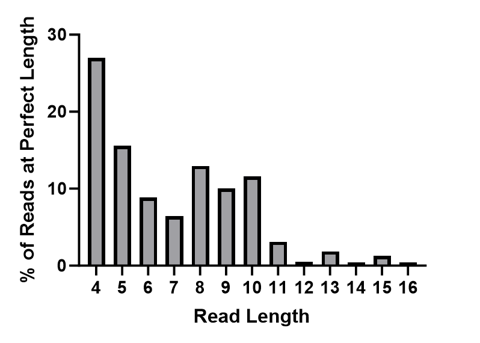
Graphical representation of “Perfect” Read Length for all of the filtered and mapped reads from S0592.
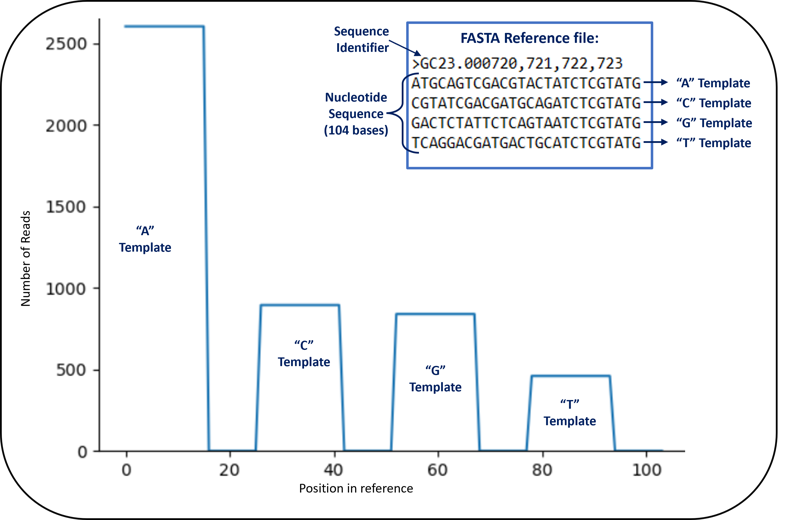
Another helpful bit of information from the .html summary is the alignment graph below. In a typical NGS analysis, you would take your sequencing data and run it through an alignment tool that compares basecalls to an organism-specific reference sequence. Since we are sequencing short synthetic templates we designed ourselves, we can create our own reference and align our sequencing data to that reference. The figure below shows a snippet of our 104 nucleotide reference sequence. There were 4 templates included in the reference sequence, each 26 nucleotides long. Since we only sequenced 16 bases, we expected all of our reads to align to positions 1-16, 27-42, 53-68, and 79-94 in the reference sequence. Those positions correspond to the first 16 bases in the A, C, G, and T templates.
There are numerous other outputs, including the sequencing output in FASTQ format. You can use the existing 454 Bio toolset to look deeply at your data, utilize your favorite existing tools, or create you own and share your tools and results with the 454 Bio Community!